The energy sector is not immune to inequality. Although this is not news to the millions of households in the United States experiencing energy burdens, broader awareness of our country’s unequal energy system impacts has accelerated in the past few years. Momentum around these issues has manifested in new clean energy policies. It has also produced a commitment to improving diversity, equity, and inclusion (DEI) in utility programs. To reduce energy burdens and include equity in their clean energy strategies, utilities are moving beyond traditional income-qualified programs, which focused on whole-house weatherization. They’re also considering equity impacts for all programs and working proactively with communities to design programs with better energy and non-energy benefits.
April 2022’s GridFWD Seattle conference included many DEI topics, and we had the opportunity to attend several DEI-focused seminars and reflect on the important messages. Based on GridFWD sessions, interviews with key practitioners, and our own experiences leading equity-focused research, planning, and evaluation, we developed posts exploring key elements for achieving equity in energy programs. In this series we will highlight two strategies for achieving equitable outcomes:
- Better Tools to Make Data-Driven Decisions
- Community Engagement – Early Partnering with Community-based Organizations
Better Tools to Make Data-Driven Decisions
Data-driven solutions for addressing equity are proliferating in the energy industry. These tools are important complements to other strategies, like engaging communities and embedding equity requirements in policy. Utilities also use broader, more inclusive definitions of DEI to identify priority customers—specifically including factors beyond traditional income eligibility. We see utilities expanding their tool kits to include equity metrics, composite indices, customer segmentation, and geographic targeting. These tools demonstrate that utilities are taking equity more seriously in resource planning. Simply put, these tools help utilities address questions critical to better serving historically underserved communities.
In particular, locational analyses can:
- Prioritize historically disadvantaged customers and communities.
- Assess trends or technology distributions across a utility territory.
- Identify gaps in historic program delivery for key segments.
- Evaluate divergent variables to optimize for customer targeting and benefit optimization.
- Align distribution systems and grid assets with priority communities and factors informing non-wires solutions (e.g., aging infrastructure, outage frequency/duration).
During the April 2022 GridFWD Seattle conference, several sessions covered advanced approaches that provide more granular understanding of vulnerable populations. The geospatial dimensions associated with types of benefits, such as environmental effects, risk, and resiliency, were also covered. Esri and the National Renewable Energy Laboratory (NREL) and the Los Angeles Department of Water and Power presented mapping tools they developed to profile social equity and generate indices. These mapping tools will strategically deliver infrastructure, programs, and services. Such tools help utilities make better decisions and incorporate equity in the planning process.
Geospatial Solutions
Pat Hohl, the director of electric utility solutions, overviewed Esri’s GIS capabilities, which use underlying geospatial and customer attribute data to perform social equity analysis.[1] Esri has curated socioeconomic and demographic data and provides a platform that allows base data sets to be supplemented with local data, flexibly allowing end users to integrate the best available data sources into one tool. Additionally, this approach allows users to define key variables to feed into developing an equity index. As a result, users have easy access to complex analytic outputs. This platform also allows jurisdictional or community-specific definitions when developing a composite variable to better target priority groups. Flexibility and access are invaluable in supporting inclusion, user preference, and modular data sources to tailor analyses down to a local level.
Block by Block: Los Angeles’s Granular Energy Transition
Jaquelin Cochran, director of grid planning at NREL, and Louis Ting, director of power engineering and technical services at the Los Angeles Department of Water and Power, presented the Los Angeles 100% Renewable Energy Study (LA100) and the associated geospatial tools.[2] NREL developed a data-driven approach for LA100 that helped explore pathways to achieving a 100% clean energy goal. This study involved community engagement through an advisory group of local partners looking holistically at study implications (e.g., feasibility, reliability, public health, economic development). A central conclusion was that disadvantaged communities could receive a range of energy and non-energy benefits from the city’s energy transition. NREL’s model provided locational forecasts for different resource pathways (e.g., solar). However, it recognized the need for better data (e.g., charging behavior across different demographics) in some areas to improve the accuracy of targeting for development.
Valuing Community Benefits Through Locational Distributed Energy Resource Forecasting
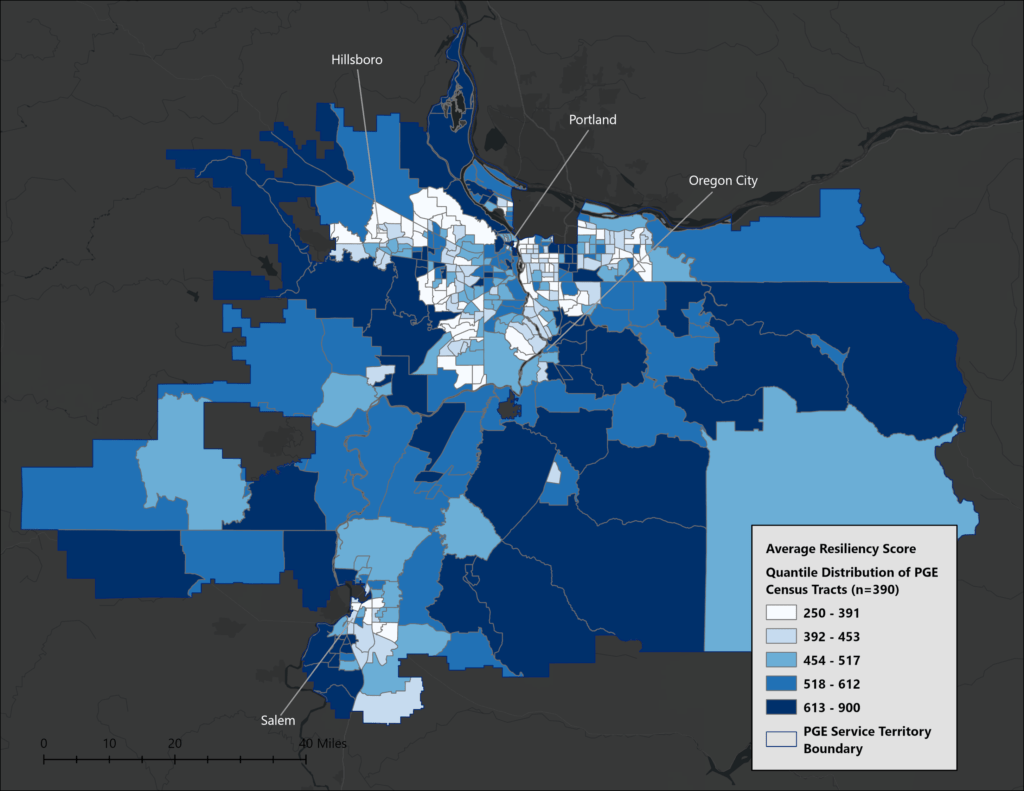
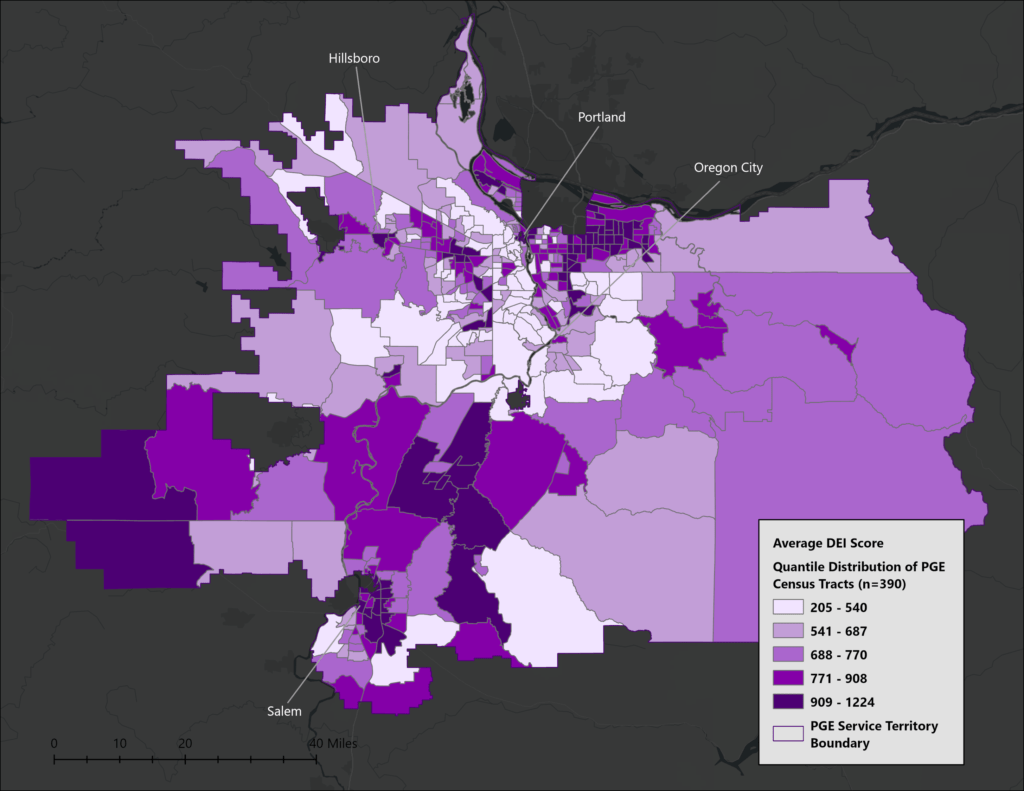
In a similar vein, Cadeo recently developed a locational planning tool for Portland General Electric (PGE) to support its distribution system planning process.[3] In 2020, Cadeo created PGE’s distributed energy resource (DER) potential model and adoption forecast: AdopDER. AdopDER provides a locational forecast at the premise-level for 20 to 30 different DERs. In 2022, we developed a new module for AdopDER to incorporate three indices to include equity, environment, and resilience factors into their distribution system planning process. Specifically, this module supported siting of an upcoming non-wires solution pilot. This study involved identifying data sources and equity variables and using feedback from community-based organizations to guide priority variable selection. It also used statistical and spatial analysis to develop these indices. Finally, we provided mapping outputs to show how forecasted DER adoption intersects with the highest scoring areas for target communities, potential environmental impacts, and resilience risk.
Customer Solutions and Locational Targeting
Locational targeting is gaining momentum on the customer solutions side as well. DTE Energy recently conducted a geographic analysis that identified and characterized income-qualified customers and historic participation trends. The aim of this study was to understand values and barriers, enhance engagement, and target delivery strategies to specific customer segments. The study involved a phased approach: first, developing DEI metrics to identify scale, characteristics, and locations of current disparities, and second, conducting targeted research, and finally, using these findings to inform tailored engagement strategies.
Also on the customer solutions side, Washington utilities like Puget Sound Energy (PSE) are developing clean energy implementation plans as required by the state’s Clean Energy Transformation Act.[4] These plans require locational analysis to identify highly impacted customers and vulnerable populations. Additionally, the plans have strategies for including these communities in proposed clean energy program planning.[5] For example, PSE has identified 27% of its customers are within highly impacted communities, defined within 164 census tracts that meet associated scoring criteria. Through a community engagement process, PSE co-created a set of community benefits (including energy and non-energy impacts). PSE is also working on developing metrics to quantify the incremental benefits that occur in these specific communities through a new suite of proposed energy programs.
Example Applications of Locational Analysis
Public tools are also available to support these efforts at national, state, and local levels. A few examples include the White House’s Climate and Economic Justice Screening Tool, the Washington Department of Health’s Environmental Health Disparities Map, and the Portland Bureau of Transportations Equity Matrix.
Many data-driven tools are emerging to help utilities and planners be more equitable in program design, delivery, and resource allocation. The best tools share key elements of granular and location-specific data sources. Also, access to public sources and flexibility to provide tailored information to unique territories and research needs. There are many different options for locational analysis tools, all available in different sectors or geographies and influenced by utility/application. Regardless of the tool, it’s promising to see momentum build behind data-driven approaches to identifying underserved communities. Better tools bridge the gap toward increasing access of clean energy services for these customers.
Special thanks to GridFWD, Kevin Bilyeu of DTE, Jaquelin Cochran of NREL, and Pat Hohl of Esri for their help with this article.
About the Authors
Scott is a director on Cadeo’s Distributed Energy Resources team. He brings over 15 years of experience developing, directing, and implementing research aimed at improving performance of energy programs. He is focused on improving strategy and outcomes of energy programs at the intersection of equity and clean energy planning. Scott has extensive experience in planning, design, and evaluation of income-qualified energy programs, including traditional EM&V, non-energy benefits, and locational analysis.
Contact: sreeves@cadeogroup.com
Peter is a senior associate for Cadeo’s Emerging Tech team and is a building scientist with over a decade of experience in residential efficiency programs. He currently leads projects for Cadeo that consider diverse perspectives to driving the energy transition. His recent work includes a market study for the Portland Clean Energy Fund, focused on climate justice investments. Prior to joining Cadeo, Peter worked at Community Energy Project. There, he was program director for the in-homes team developing and implementing low-income energy programs.
Contact: pkernan@cadeogroup.com
[1] Michael Brown, “Social Equity Analysis Solution Released,” ArcGIS Blog, November 18, 2021, https://www.esri.com/arcgis-blog/products/arcgis-solutions/local-government/social-equity-analysis-solution-released/.
[2] National Renewable Energy Laboratory (NREL), LA100: The Los Angeles 100% Renewable Energy Study, https://www.nrel.gov/analysis/los-angeles-100-percent-renewable-study.html.
[3] Cadeo Group, “Community Targeting Assessment,” prepared for PGE, https://assets.ctfassets.net/416ywc1laqmd/6MfsUWuIOgijDbloGpOPlR/e0fb5b68f3375f7c995c80cb353c2e1e/PGE_Cadeo_Memo_Equity_Index_and_Community_Targeting_Assessment.pdf.
[4] Puget Sound Energy (PSE), Clean Energy Implementation Plan, https://www.cleanenergyplan.pse.com/.
[5] Washington defines highly impacted customers by tribal areas and census tracts with high disparity scoring, which uses the state Department of Health’s Environmental Health Disparities map and accounts for environmental, demographic, and socioeconomic factors.
Achieving Equity in Energy Programs: Better Tools and Community Engagement (Part 1)
The energy sector is not immune to inequality. Although this is not news to the millions of households in the United States experiencing energy burdens, broader awareness of our country’s unequal energy system impacts has accelerated in the past few years. Momentum around these issues has manifested in new clean energy policies. It has also produced a commitment to improving diversity, equity, and inclusion (DEI) in utility programs. To reduce energy burdens and include equity in their clean energy strategies, utilities are moving beyond traditional income-qualified programs, which focused on whole-house weatherization. They’re also considering equity impacts for all programs and working proactively with communities to design programs with better energy and non-energy benefits.
April 2022’s GridFWD Seattle conference included many DEI topics, and we had the opportunity to attend several DEI-focused seminars and reflect on the important messages. Based on GridFWD sessions, interviews with key practitioners, and our own experiences leading equity-focused research, planning, and evaluation, we developed posts exploring key elements for achieving equity in energy programs. In this series we will highlight two strategies for achieving equitable outcomes:
Better Tools to Make Data-Driven Decisions
Data-driven solutions for addressing equity are proliferating in the energy industry. These tools are important complements to other strategies, like engaging communities and embedding equity requirements in policy. Utilities also use broader, more inclusive definitions of DEI to identify priority customers—specifically including factors beyond traditional income eligibility. We see utilities expanding their tool kits to include equity metrics, composite indices, customer segmentation, and geographic targeting. These tools demonstrate that utilities are taking equity more seriously in resource planning. Simply put, these tools help utilities address questions critical to better serving historically underserved communities.
In particular, locational analyses can:
During the April 2022 GridFWD Seattle conference, several sessions covered advanced approaches that provide more granular understanding of vulnerable populations. The geospatial dimensions associated with types of benefits, such as environmental effects, risk, and resiliency, were also covered. Esri and the National Renewable Energy Laboratory (NREL) and the Los Angeles Department of Water and Power presented mapping tools they developed to profile social equity and generate indices. These mapping tools will strategically deliver infrastructure, programs, and services. Such tools help utilities make better decisions and incorporate equity in the planning process.
Geospatial Solutions
Pat Hohl, the director of electric utility solutions, overviewed Esri’s GIS capabilities, which use underlying geospatial and customer attribute data to perform social equity analysis.[1] Esri has curated socioeconomic and demographic data and provides a platform that allows base data sets to be supplemented with local data, flexibly allowing end users to integrate the best available data sources into one tool. Additionally, this approach allows users to define key variables to feed into developing an equity index. As a result, users have easy access to complex analytic outputs. This platform also allows jurisdictional or community-specific definitions when developing a composite variable to better target priority groups. Flexibility and access are invaluable in supporting inclusion, user preference, and modular data sources to tailor analyses down to a local level.
Block by Block: Los Angeles’s Granular Energy Transition
Jaquelin Cochran, director of grid planning at NREL, and Louis Ting, director of power engineering and technical services at the Los Angeles Department of Water and Power, presented the Los Angeles 100% Renewable Energy Study (LA100) and the associated geospatial tools.[2] NREL developed a data-driven approach for LA100 that helped explore pathways to achieving a 100% clean energy goal. This study involved community engagement through an advisory group of local partners looking holistically at study implications (e.g., feasibility, reliability, public health, economic development). A central conclusion was that disadvantaged communities could receive a range of energy and non-energy benefits from the city’s energy transition. NREL’s model provided locational forecasts for different resource pathways (e.g., solar). However, it recognized the need for better data (e.g., charging behavior across different demographics) in some areas to improve the accuracy of targeting for development.
Valuing Community Benefits Through Locational Distributed Energy Resource Forecasting
In a similar vein, Cadeo recently developed a locational planning tool for Portland General Electric (PGE) to support its distribution system planning process.[3] In 2020, Cadeo created PGE’s distributed energy resource (DER) potential model and adoption forecast: AdopDER. AdopDER provides a locational forecast at the premise-level for 20 to 30 different DERs. In 2022, we developed a new module for AdopDER to incorporate three indices to include equity, environment, and resilience factors into their distribution system planning process. Specifically, this module supported siting of an upcoming non-wires solution pilot. This study involved identifying data sources and equity variables and using feedback from community-based organizations to guide priority variable selection. It also used statistical and spatial analysis to develop these indices. Finally, we provided mapping outputs to show how forecasted DER adoption intersects with the highest scoring areas for target communities, potential environmental impacts, and resilience risk.
Customer Solutions and Locational Targeting
Locational targeting is gaining momentum on the customer solutions side as well. DTE Energy recently conducted a geographic analysis that identified and characterized income-qualified customers and historic participation trends. The aim of this study was to understand values and barriers, enhance engagement, and target delivery strategies to specific customer segments. The study involved a phased approach: first, developing DEI metrics to identify scale, characteristics, and locations of current disparities, and second, conducting targeted research, and finally, using these findings to inform tailored engagement strategies.
Also on the customer solutions side, Washington utilities like Puget Sound Energy (PSE) are developing clean energy implementation plans as required by the state’s Clean Energy Transformation Act.[4] These plans require locational analysis to identify highly impacted customers and vulnerable populations. Additionally, the plans have strategies for including these communities in proposed clean energy program planning.[5] For example, PSE has identified 27% of its customers are within highly impacted communities, defined within 164 census tracts that meet associated scoring criteria. Through a community engagement process, PSE co-created a set of community benefits (including energy and non-energy impacts). PSE is also working on developing metrics to quantify the incremental benefits that occur in these specific communities through a new suite of proposed energy programs.
Example Applications of Locational Analysis
Public tools are also available to support these efforts at national, state, and local levels. A few examples include the White House’s Climate and Economic Justice Screening Tool, the Washington Department of Health’s Environmental Health Disparities Map, and the Portland Bureau of Transportations Equity Matrix.
Many data-driven tools are emerging to help utilities and planners be more equitable in program design, delivery, and resource allocation. The best tools share key elements of granular and location-specific data sources. Also, access to public sources and flexibility to provide tailored information to unique territories and research needs. There are many different options for locational analysis tools, all available in different sectors or geographies and influenced by utility/application. Regardless of the tool, it’s promising to see momentum build behind data-driven approaches to identifying underserved communities. Better tools bridge the gap toward increasing access of clean energy services for these customers.
Special thanks to GridFWD, Kevin Bilyeu of DTE, Jaquelin Cochran of NREL, and Pat Hohl of Esri for their help with this article.
About the Authors
Scott is a director on Cadeo’s Distributed Energy Resources team. He brings over 15 years of experience developing, directing, and implementing research aimed at improving performance of energy programs. He is focused on improving strategy and outcomes of energy programs at the intersection of equity and clean energy planning. Scott has extensive experience in planning, design, and evaluation of income-qualified energy programs, including traditional EM&V, non-energy benefits, and locational analysis.
Contact: sreeves@cadeogroup.com
Peter is a senior associate for Cadeo’s Emerging Tech team and is a building scientist with over a decade of experience in residential efficiency programs. He currently leads projects for Cadeo that consider diverse perspectives to driving the energy transition. His recent work includes a market study for the Portland Clean Energy Fund, focused on climate justice investments. Prior to joining Cadeo, Peter worked at Community Energy Project. There, he was program director for the in-homes team developing and implementing low-income energy programs.
Contact: pkernan@cadeogroup.com
[1] Michael Brown, “Social Equity Analysis Solution Released,” ArcGIS Blog, November 18, 2021, https://www.esri.com/arcgis-blog/products/arcgis-solutions/local-government/social-equity-analysis-solution-released/.
[2] National Renewable Energy Laboratory (NREL), LA100: The Los Angeles 100% Renewable Energy Study, https://www.nrel.gov/analysis/los-angeles-100-percent-renewable-study.html.
[3] Cadeo Group, “Community Targeting Assessment,” prepared for PGE, https://assets.ctfassets.net/416ywc1laqmd/6MfsUWuIOgijDbloGpOPlR/e0fb5b68f3375f7c995c80cb353c2e1e/PGE_Cadeo_Memo_Equity_Index_and_Community_Targeting_Assessment.pdf.
[4] Puget Sound Energy (PSE), Clean Energy Implementation Plan, https://www.cleanenergyplan.pse.com/.
[5] Washington defines highly impacted customers by tribal areas and census tracts with high disparity scoring, which uses the state Department of Health’s Environmental Health Disparities map and accounts for environmental, demographic, and socioeconomic factors.
by
Recent Posts
EVs for Resiliency
Grid resiliency was the central topic of the 2022 GridFWD conference in Denver, Colorado. The 2023 conference is coming back to the Pacific Northwest this
The Unexpected Impact of Representative Test Procedures
Introduction Many people join the sustainability industry because they want to make a difference. They enter with visions of planting trees and scrubbing crude oil
Building Community Resilience: Creating an Equitable Clean Energy System
In October 2022, Grid Forward (GridFWD) hosted its annual conference for grid-focused energy professionals in Denver, Colorado. The conference’s theme, Ensuring a Resilient 21st Century
Maximizing Distributed Energy Resource Adoption with Hosting Capacity Analysis
Distributed Energy Resources (DERs)—generally customer-owned solar photovoltaics (PV) and battery storage systems—provide significant grid benefits, including increased low-carbon power generation, relieved distribution and transmission capacity
AdopDER: Using Open Tools for a Comprehensive Distributed Energy Resource Forecast
Fred Schaefer, a principal on the Distributed Energy Resources (DER) team at Cadeo, is the author of this month’s post on DER forecasting. He and
Heat Pump Water Heaters: Bathing in Efficiency
When you roll out of bed in the morning and fumble for the shower faucet, hot water soon emerges to pull you from slumber. Irrespective