Distributed Energy Resources (DERs)—generally customer-owned solar photovoltaics (PV) and battery storage systems—provide significant grid benefits, including increased low-carbon power generation, relieved distribution and transmission capacity constraints, and improved grid resiliency. However, if left unaccounted for, DERs can also reduce safety, reliability, and power quality, especially as more systems come online. Potential issues include voltage and frequency anomalies and inadvertently overloading the grid with excess power during periods of low load. To ensure that DERs connect without causing issues to the grid or other customers, utilities have interconnection procedures that outline the technical and operational requirements. DERs must meet these requirements to export power back to the grid.
Across the country, utilities are experiencing rapid growth in interconnection applications for DERs and they’re finding it challenging to manage. Overburdened and outdated interconnection procedures that rely on manual review and approval drive most of the setbacks that utilities face. These procedures have become a major bottleneck toward increasing access to DERs and decarbonizing the power sector. Fortunately, researchers, regulators, activists, and utility staff are identifying new ways to process high volumes of DER applications as quickly and efficiently as possible while ensuring reliable grid operation and limiting costly infrastructure upgrades. These efforts are supported by a modeling approach known as hosting capacity analysis (HCA). HCA simulates existing grid conditions to determine the extent that the grid can accommodate or “host” DERs.
In this post, we dive into the ways DER interconnection procedures are evolving and how HCA can help. We’ll then discuss recent Cadeo research findings that show how common DER installations affect (and often improve) hosting capacity on a distribution system. Finally, we will tie it back to interconnection. We’ll explain how an HCA-based interconnection process can optimize the benefits of DER installations.
Modernizing DER Interconnection Processes
In the early days of DER adoption, utilities analyzed each DER application independently through a time- and resource-intensive system impact study. In a system impact study, an engineer analyzes how the proposed DER would interact with the circuit it connects to and determines whether the DER’s operation would cause issues that could necessitate distribution system equipment upgrades. This method works when DER applications are few and far between. However, it becomes impractical when the volume of applications spikes.
California first developed a set of interconnection screening rules, and soon after the Federal Energy Regulatory Commission (FERC) also adopted similar screens. FERC’s screening rules were part of their Small Generator Interconnection Agreements and Procedures guidance first published in 2005.[1] These screening questions allow DERs to interconnect without detailed assessment if they meet the requirements of a few rule-of-thumb metrics. One such screening metric is the “15% rule” for peak feeder load. This rule states that a DER may interconnect if its nameplate capacity is less than 15% of peak feeder load.[2] Most utilities with interconnection processes have adopted all or most of FERC’s recommended technical screens.
Although technical screens enable utilities to process DER interconnection requests much faster than before, they are based on purposely conservative metrics that are typically not reflective of the actual feeder conditions. These metrics cause many viable DER applications to fail the screening questions. Thus, the applications are redirected to backlogged interconnection queues awaiting detailed grid assessments. Additionally, prospective DER developers have no visibility into existing grid conditions. There is no way for them to identify optimal sites or design projects based around existing grid conditions. This creates a guessing game for DER developers. They don’t know whether their system will pass screening rules, leading to a shotgun approach to DER applications, which can further stress utility interconnection queues.
Screening rules represent a quick fix to the high volume of interconnection applications when grid conditions still have more than sufficient capacity to accommodate DERs. However, they are not a long-term solution. As we’ll see below, HCA has emerged as a crucial part of the solution to meet the need for a fast, straightforward interconnection process that facilitates optimal integration of DERs based on existing grid conditions.
Understanding HCA
Hosting capacity represents the amount of additional generation or load that the grid can accommodate at a specific time and location without causing issues related to safety, reliability, and power quality. It’s the main thing engineers investigate when conducting detailed system impact studies. Historically, engineers assess hosting capacity on a case-by-case basis, but the systematic HCA approach changes that. Rather than look at hosting capacity on an individual project basis, an HCA study models the entire distribution system. Then, determines the hosting capacity at all interconnection points (often called a “line segment” or “node”) along each circuit. This is no simple feat; HCA studies require state-of-the-art power system modeling software, a detailed digital model of the physical characteristics and equipment settings, the load profile, and the existing DERs on the circuit.
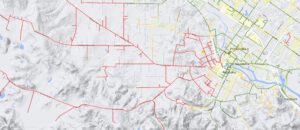
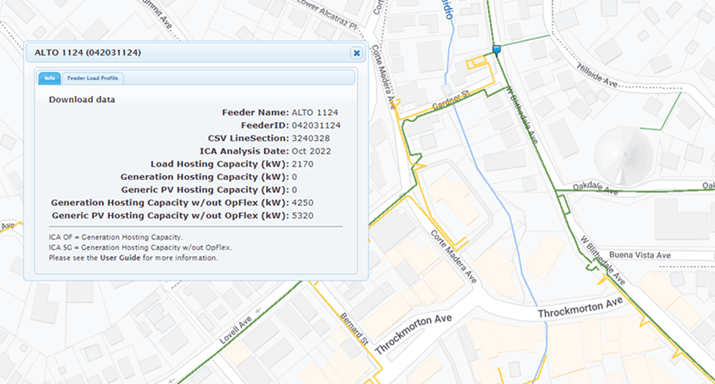
While complex, HCA studies provide utilities, regulators, and prospective DER customers with visibility into existing distribution grid conditions for the first time. These studies show when and where circuits are constrained and the area(s) of excess capacity. To visualize the HCA data, hosting capacity data can be stored on publicly available Geographic Information System (GIS) maps of the utility’s distribution systems, such as Pacific Gas and Electric’s (PG&E’s) Integration Capacity Analysis Map, which is shown in the figure below. The different color lines indicate line segments with greater (green) or less (orange) hosting capacity.
Hosting capacity does not only vary by location; it also varies daily and seasonally. Only minimum yearly values are presented on PG&E’s Integration Capacity Analysis map but each line segment’s hosting capacity is evaluated 288 times over the course of the year (24 hours for each month or one prototypical daily load shape for each month). The next two images show how the HCA profile of a PG&E line segment changes with time, for both generation hosting capacity (representing the amount of additional generation the line segment can handle) and load hosting capacity (representing the amount of additional load the line segment can handle). Below are generation and load hosting capacity profiles for the 3240328-line segment on the ALTO 1124 circuit in PG&E’s territory for the month of June from PG&E’s publicly available hosting capacity database.[4]
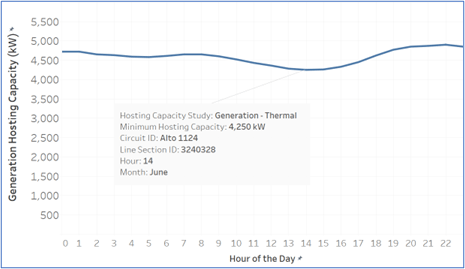
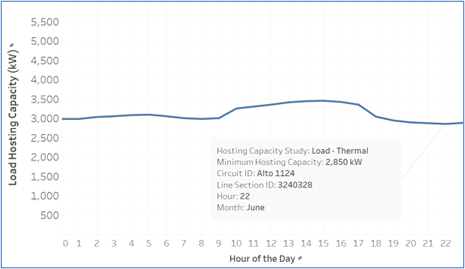
The hosting capacity graph to the left shows the generation hosting capacity profile for the 3240328-line segment on the ALTO 1124 circuit in PG&E’s territory for the month of June. The shape of the HCA profile for generation hosting capacity looks like the “duck curve,” which is not a coincidence. Generation hosting capacity reduces during periods of low load and high solar generation and increases during periods of high load and low solar generation. To the right is a second graph showing load hosting capacity. Load hosting capacity is roughly the inverse of generation hosting capacity. It represents the amount of additional load the circuit can handle before safety, reliability, and power quality issues arise. Load hosting capacity tends to be the lowest during peak load hours in the evening (i.e., high load and low generation hours).
Utilities worry about two constraining circumstances that are most likely to lead to costly grid infrastructure investments. The first is overloading circuits with excess DER generation during midday hours when the solar potential is the highest and there is low load on the circuit to absorb it. These conditions may lead to voltage or thermal violations that need to be remedied. This circumstance is visually apparent in the generation hosting capacity graph above—you can see generation hosting capacity decrease between 10 a.m. and 4 p.m.. The second circumstance utilities worry over is overloading circuits with additional load during evening hours. This happens when there is no solar generation, and the circuit is already experiencing peak load. The issue is exasperated in high-electrification future scenarios which anticipate significant load increases from electric vehicles and heat pumps. This circumstance is visually apparent in the load hosting capacity graph where load hosting capacity decreases after 5 p.m..
DERs to the Rescue
Over the last year, Cadeo has worked with the Interstate Renewable Energy Council to assess the HCA results from California investor-owned utilities (IOUs) and model how DER systems affect hosting capacity to assuage utility concerns. This project focused on grid impacts of non-exporting DER systems (i.e., DERs that do not export power back to the grid), but many of Cadeo’s findings apply to exporting systems as well. The results of the study show that even under the most conservative scenarios (i.e., periods of minimum hosting capacity) most non-exporting DER systems (generally storage-only and solar plus storage installations) either have little impact on hosting capacity or actively improve hosting capacity.
In general, solar PV systems reduce generation hosting capacity and increase load hosting capacity. However, storage systems have a lot more flexibility and can reduce or increase both generation and load hosting capacity depending on whether they are charging or discharging. When combined, a battery can help mitigate the issue of reduced generation hosting capacity caused by the solar PV system by storing excess power in the battery rather than exporting it to the grid.
The figure below shows the average yearly operational profile for a prototypical DER system Cadeo modeled using the National Renewable Energy Laboratory’s REopt® web tool.[5] The prototypical system is a non-exporting 420-kilowatt (kW) solar array with a 120-kW, 5-hour battery storage system installed on a mid-sized commercial office building in San Francisco. In this case, PV generation, site-specific demand charges and time-of-use rates drive the charge and discharge schedule of the battery.[6] The net load shape[7] (orange line) shows the battery and solar system working together to reduce the amount of power the grid provides. Between 4 a.m. and 9 a.m. and 3 p.m. and 11 p.m., the battery discharges to the customer. Between 7 a.m. and 6 p.m., the solar PV system discharges to the customer and charges the battery.
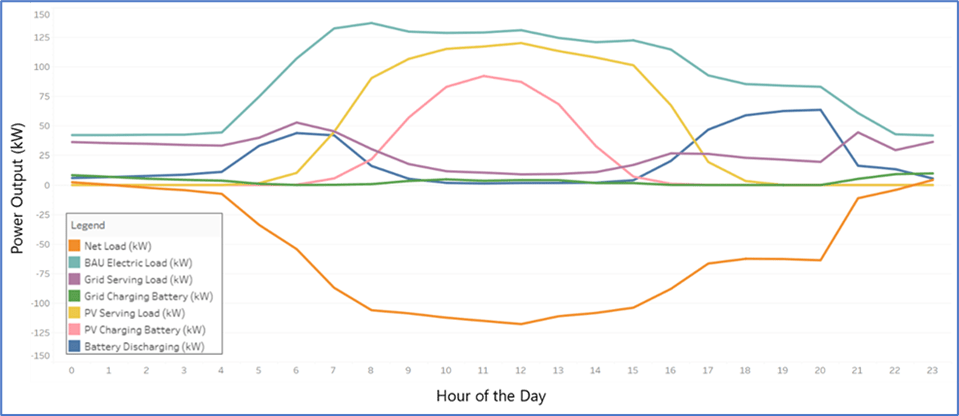
Any time that net load reduces, load hosting capacity improves. For the system shown in the figure above, that means that load hosting capacity improves during all daytime hours. This is notable during peak load periods. In future high-electrification scenarios, where residential and commercial loads increase dramatically due to the adoption of electric vehicles and heat pumps, this increase in load hosting capacity can provide significant benefits by delaying the need for costly grid upgrades to handle the increase in load.
On the other hand, when net load decreases, generation hosting capacity also decreases. Thus, the system shown above reduces generation hosting capacity in the daytime hours. Fortunately, this reduction in generation hosting capacity can be mitigated by developing modified rate schedules. These rate schedules disincentivize DER power export during low load, peak solar generating hours. Additionally, larger battery systems that can absorb more energy on-site during low-load, peak-solar-generating hours can also help mitigate generation capacity constraints.
The Future of HCA
California IOUs PG&E, San Diego Gas & Electric, and Southern California Edison recently became the first utilities in the United States to provide publicly available hosting capacity GIS maps and underlying data sets for their entire distribution system. In the future, they will also become the first utilities to leverage their hosting capacity data in their DER interconnection tariff, known as Rule 21.[8] The two major changes to Rule 21 related to HCA are:
- The new interconnection procedure will replace the most commonly failed screen (the 15% of peak load screen) with a screen that evaluates whether the system’s nameplate capacity is less than HCA’s minimum hosting capacity value at the location of the project. If the project passes the HCA screen and others, it can bypass the detailed system impact study. Systems that pass this new screen will have no schedule limitations on the generation capacity.
- Rule 21 will establish a new class of DERs that utilize something known as a “Limited Generation Profile.” This class will cover projects where developers choose to define operating schedules that align with the HCA data. For example, if the HCA states that the minimum hosting capacity at a given line segment at 11 a.m. in March is 160 kW, then a DER interconnecting at that node will not be able to export more than 160 kW during that time, regardless of its nameplate capacity. Advanced operating controls will be incorporated to ensure that the DER does not exceed the hosting capacity at any given time.
These changes to California IOU interconnection procedures represent a monumental shift in how utilities assess DERs for grid interconnection. By incorporating information on grid conditions from HCA into the interconnection procedure, more DERs will be able to connect to the grid at reduced costs to both the customer and the utility. In addition, HCA provides a powerful data set to help DER developers intelligently optimize their DER resources. This provides more confidence that interconnection approvals will be granted—easing the process both from the utility and the customer perspective. Researchers agree that DERs need to play a pivotal role in efforts to decarbonize the power sector. HCA is a powerful tool and its use in interconnection procedures is only the beginning. Stakeholders are already considering new use cases such as incorporating HCA into distribution resource planning to identify constrained areas on the grid that could benefit most from capacity upgrades.
[1] https://www.ferc.gov/industries-data/electric/electric-transmission/generator-interconnection/standard-interconnection
[2] In reality, it is the minimum load that matters to hosting capacity, but that information was not readily available at the time the technical screens were published. For more information on the 15% penetration threshold, see the NREL paper: https://www.nrel.gov/docs/fy12osti/54063.pdf
[3]PG&E (Pacific Gas & Electric), “Integration capacity Analysis and Distribution Investment Deferral Framework Maps,” Distributed Resource Planning (DRP) Data and Maps, https://www.pge.com/en_US/for-our-business-partners/distribution-resource-planning/distribution-resource-planning-data-portal.page; note: California Investor-Owned Utilities use the term “Integration Capacity Analysis” rather than “Hosting Capacity Analysis.”
[4] PG&E (Pacific Gas & Electric), “Integration capacity Analysis and Distribution Investment Deferral Framework Maps,” Distributed Resource Planning (DRP) Data and Maps, https://www.pge.com/en_US/for-our-business-partners/distribution-resource-planning/distribution-resource-planning-data-portal.page; note: California Investor-Owned Utilities use the term “Integration Capacity Analysis” rather than “Hosting Capacity Analysis.”
[5] NREL (National Renewable Energy Laboratory), REopt: Renewable Energy Integration & Optimization, https://reopt.nrel.gov/tool.
[6] PG&E, Electric Schedule B-10: Medium General Demand-metered Service, issued by Robert S. Kenney, July 8, 2021, https://www.pge.com/tariffs/assets/pdf/tariffbook/ELEC_SCHEDS_B-10.pdf.
[7] Net load represents the amount of additional load served by the grid compared to a baseline where the DER does not exist. If net load is negative, that means that the DER is sending power to the customer. This reduces the amount of power the grid needs to provide. If net load is positive, that means the DER is charging. This increases the amount of power the grid needs to provide.